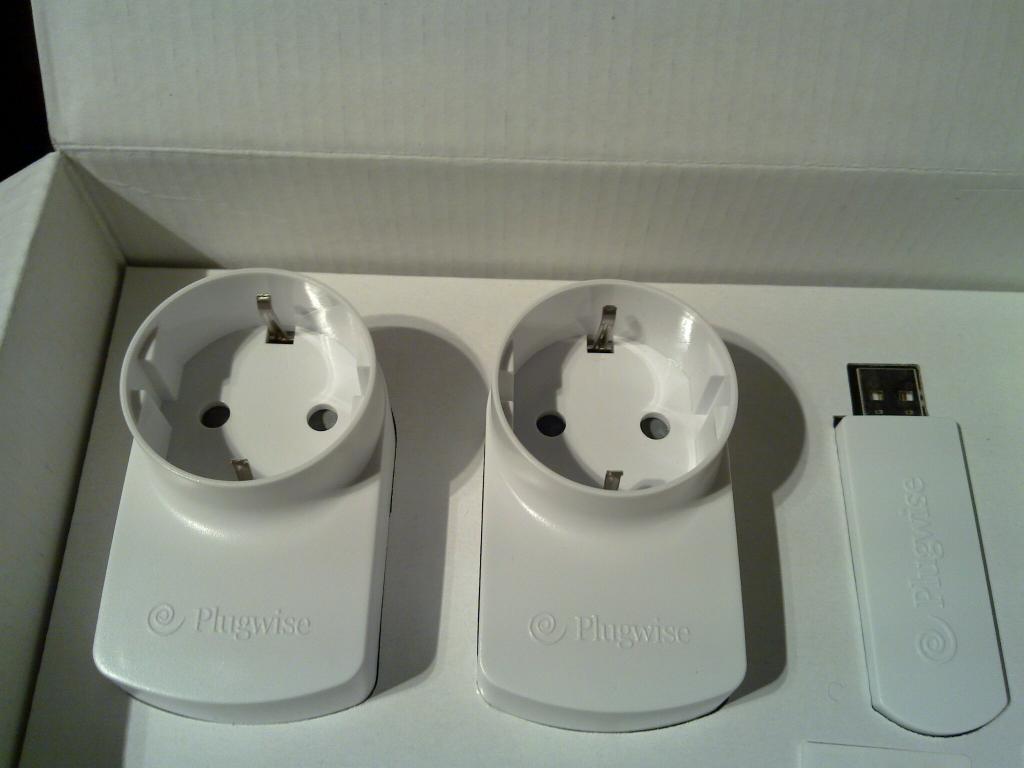
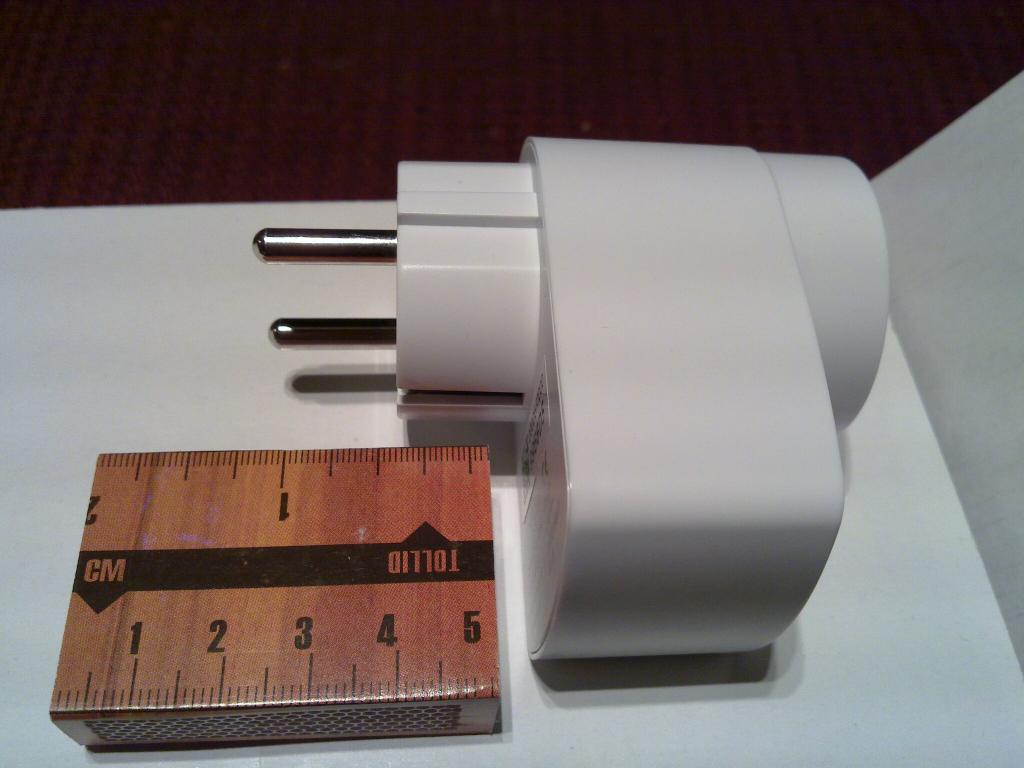
Last year I bought a new larger greenhouse (lwh: 6x4x2.8m). Currently it looks like this:
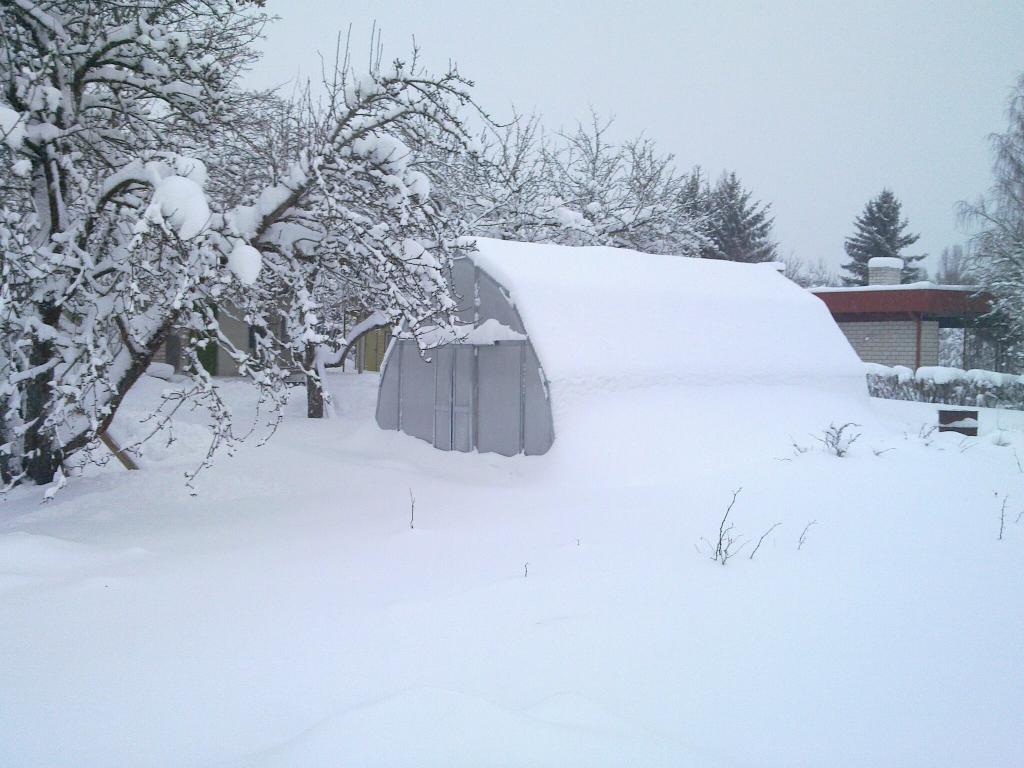
Which means that I don’t have to deal with actually growing things at the moment and now is a good time to make preparations for the next season.
My ideal is to automate it as much as possible, so first I will try to automate the obvious things like watering and ventilation. In the future things like heating and growlights might be added too.
I have spent several weekends on that project with my friend Kalle who helps me on the electrical engineering front and finally we have something that more or less works.
The current solution consists of controller board & sensor board in the greenhouse. Controller is run by Arduino and controls 220V power outlet & gathers information from various sensors. Bidirectional datalink with the house is done over ZigBee radio. In the house I have a Beagleboard which logs data, draws nice graphs, serves these over the internet and can control Arduino.
The greenhouse controller looks like this:
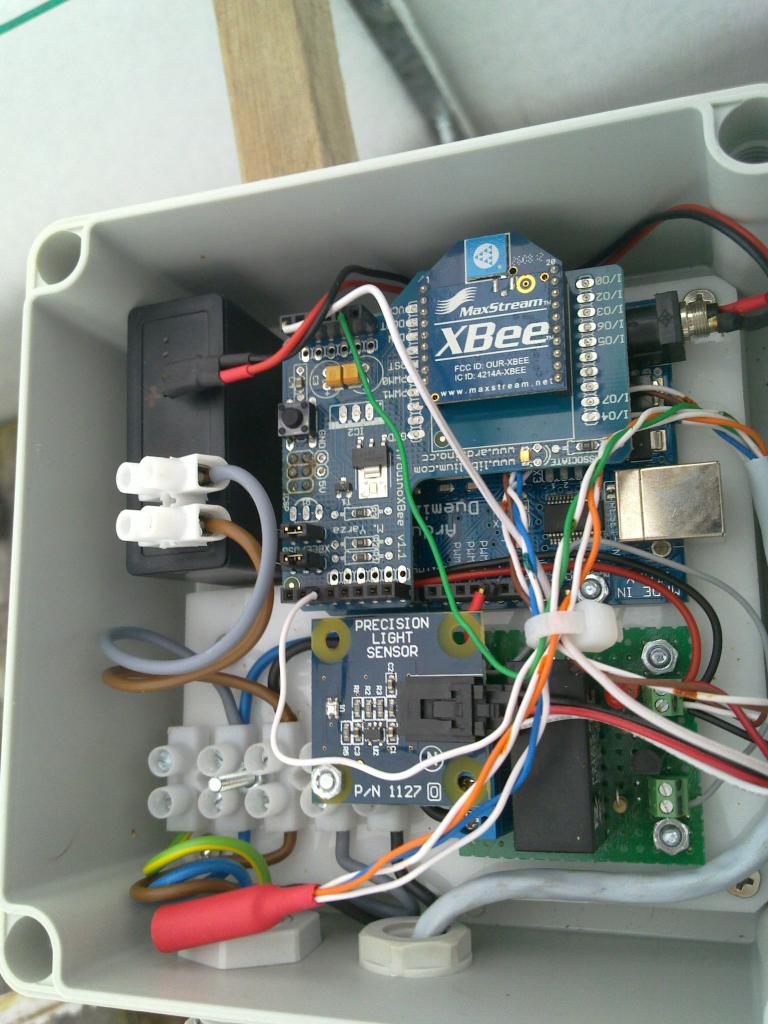
It consists of:
Some of the Arduinos IO pins are connected to the CAT5 cable that runs to small external sensor board:
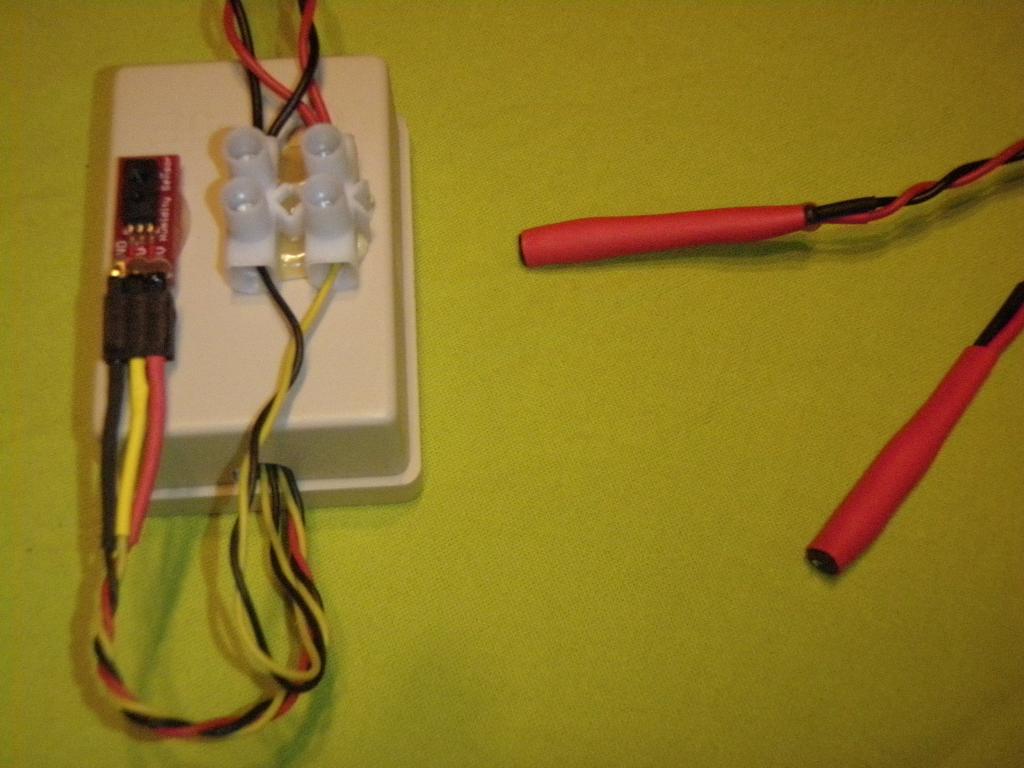
The sensor board has following sensors connected to it:
The sensors and connections are protected from the environment mainly by having them covered by a thick layer of hot glue.
First version of the sensor board used LM35 analog temperature sensors which were nice and easy to interface with but thanks to their analog nature were rather sensitive cable length and small voltage flux on the Arduino that was caused by the relay switching and other sensors. Besides LM35 outputs negative voltage for temperatures below 0 deg. C which you can’t measure in a direct way from Arduino.
I haven’t had time yet to document the schematics & connections but for similar well documented project you can take a look here and here.
And here’s how it’s currently “installed”:
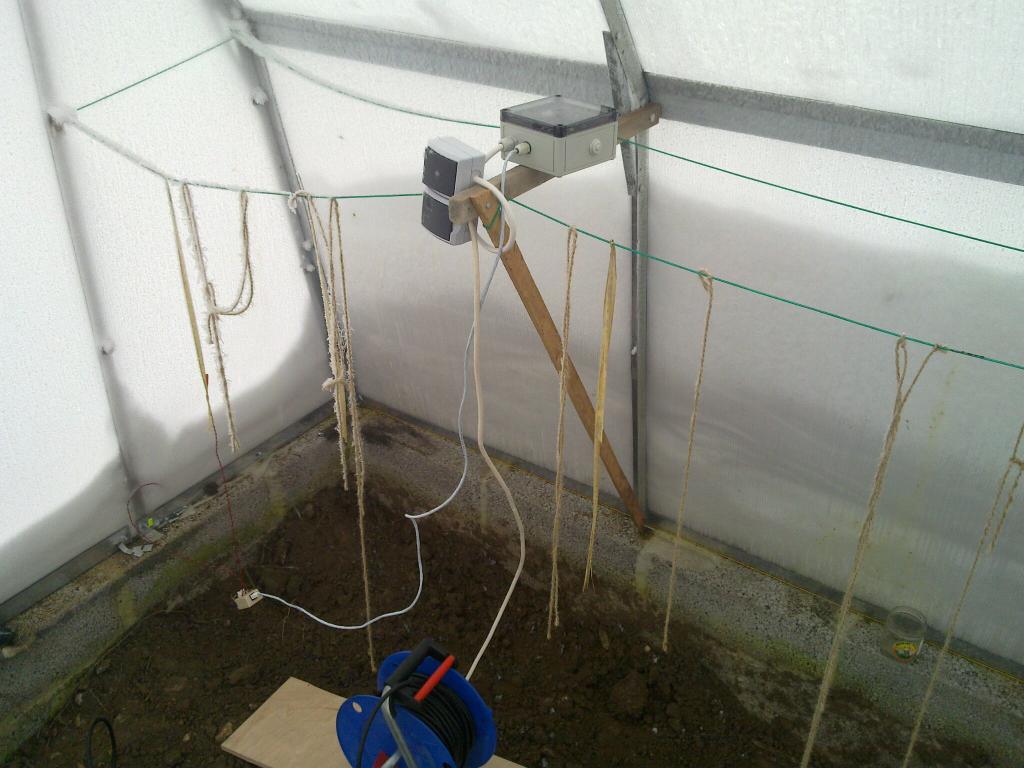
The power socket/switch that you see right next to the controller box is meant for the water pump and switch is used to override Arduinos decisions if need be.
Software wise things are quite simple at the moment – controller periodically gathers data from all the sensors and prints them in a line similar to:
H121 T-28.8 T-10.0 L192
Where letter indicates sensor type and number is determined by the position. Since the arduinos serial output is really connected to the ZigBee module I can just read it from the other side of the radio link as though the devices were directly connected with serial cable.
So the code running on Arduino is just this:
#include <OneWire.h>
#include <DallasTemperature.h>

#define ONE_WIRE_BUS 2

OneWire oneWire(ONE_WIRE_BUS);

DallasTemperature sensors(&oneWire);

#define MEASURE_CYCLE_TIME 5000

int humidity_pin = 1;// input pin for the humidity sensor
int light_pin = 5; // input pin for the light sensor
int relay_pin = 12;   // relay switch
float val = 0; // variable for storing sensor value

void setup() {
  pinMode(relay_pin, OUTPUT);
  digitalWrite(relay_pin, LOW);
  Serial.begin(9600);
  sensors.begin();
}

float get_temp(int pin) {
  float val;

  return sensors.getTempCByIndex(pin);
}

void show_temp(float v) {
  Serial.print("T");
  Serial.print(v);
  Serial.print(" ");
}

void loop() {
  sensors.requestTemperatures();
  val = get_temp(0);
  show_temp(val);
  val = get_temp(1);
  show_temp(val);

  val = analogRead(humidity_pin);
  Serial.print("H");
  Serial.print(val);

  val = analogRead(light_pin);
  Serial.print(" L");
  Serial.print(val);
  Serial.print("\n");

  delay(MEASURE_CYCLE_TIME);
} |
And on the Beagleboard it’s even simpler:
import serial
import os
import time
import traceback

SAMPLE_WRITE_TIME = 5*60
DATA_DEVICE = "/dev/ttyUSB0"

"""
to create the RRD file:
rrdtool create temperature.rrd --step 300 \
  DS:temp1:GAUGE:600:-273:5000 \
  DS:temp2:GAUGE:600:-273:5000 \
  DS:light:GAUGE:600:0:1000 \
  DS:humidity:GAUGE:600:-273:5000 \
  RRA:AVERAGE:0.5:1:1200 \
  RRA:MIN:0.5:12:2400 \
  RRA:MAX:0.5:12:2400 \
  RRA:AVERAGE:0.5:12:2400
"""

last_ts = None

ser = serial.Serial(DATA_DEVICE, 9600)

def calculate_relative_humidity(raw_humidity_val, temperature_c):
    """converts raw HIH4030 output to relative humidity %"""
    # see http://www.arduino.cc/cgi-bin/yabb2/YaBB.pl?num=1267245927/3 for discussion
    if __debug__:
        print raw_humidity_val,temperature_c

    ZERO_PERC_VOLTAGE = 0.8

    max_voltage = (3.27-(0.006706*temperature_c))
    relative_humidity = ((((raw_humidity_val/1023)*5)-ZERO_PERC_VOLTAGE)/max_voltage)*100

    if relative_humidity > 100.0:
        # if it's  saturated/frozen it outputs raw values around 920 which would lead to
        # RH% in the range on 120 which is theoretically possible but probably just an
        # measurement error / problem with the equation
        return 100.0

    return relative_humidity

def write_sample():
    global last_ts

    l = ser.readline()
    # input is expected to be similar to "T-23 T-10 H100 L20\n"
    if __debug__:
        print "raw:",l,

    temp1, temp2, humidity, light = [float(x[1:]) for x in l.strip().split()]
    humidity = calculate_relative_humidity(humidity, temp2)
    if __debug__:
        print temp1,temp2,humidity,light

    if last_ts is None or (last_ts + SAMPLE_WRITE_TIME) < time.time():
        cmd = "rrdtool update temperature.rrd N:%f:%f:%f:%f" % (temp1, temp2, light, humidity)
        os.system(cmd)
        last_ts = time.time()
        if __debug__:
            print "cmd:",cmd

while 1:
    try:
        write_sample()
    except KeyboardInterrupt:
        raise
    except:
        print "write failed"
traceback.print_exc() |
Here’s some sensor data from today:
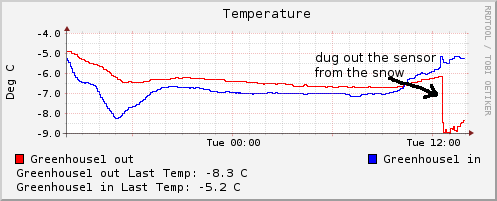


live data available through Pachube feed
And here’s a picture of the Beagleboard at the garage that gathers data & serves the graphs
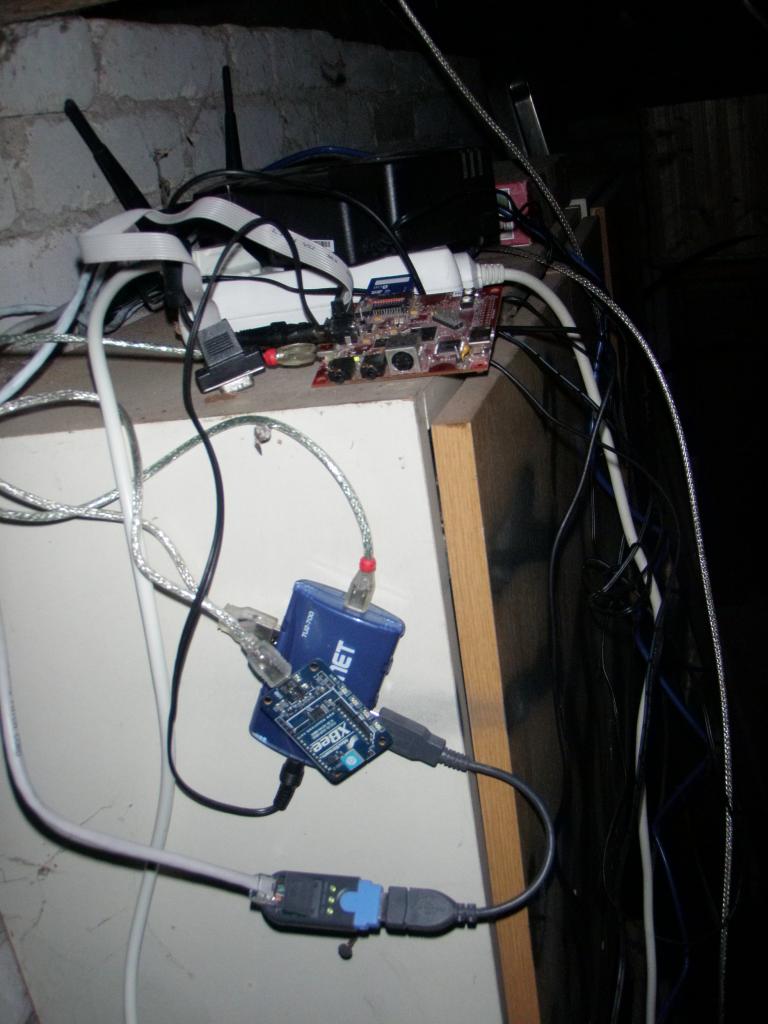
Actually getting the Beagleboard working in a suitable manner turned out to be the most complicated part of the whole project. It took 3-4 days in total over a month or so while I reinstalled different distributions, replaced broken SD card, tried more than 10 different versions of the kernel and u-boot and finally removed a capacitor from the Beagleboard to get it stable. Hopefully I will write a separate post about that in the near future 🙂
